Unlike office, retail and other commercial real estate assets, which often require additional maintenance and derive much of their value from property improvements, farmland’s demand is driven by population growth and much of its value comes from the real property itself.
AS THE POPULATION GROWS, SO DOES THE DEMAND FOR FARMLAND

FOOD
The world population is expected to grow to 9.7 billion people by 2050.2 More mouths to feed, matched with a finite supply of arable land, means farmland may become even more essential in the future.

FEED
Population growth and shifting lifestyles can cause an increase in demand for meat proteins, and, in turn, a significant increase in demand for feed crops. To gain one pound of beef, cattle must consume an additional six pounds of feed grain daily.3

FIBER
Like feed, population growth also drives the demand for fiber for use in clothing, plastics and other goods. The average American consumes 26.5 pounds of cotton per year.4
WHY INVEST IN FARMLAND?
Farmland offers many of the same potential benefits of traditional real estate investments, combined with additional possible advantages unique to its asset class.
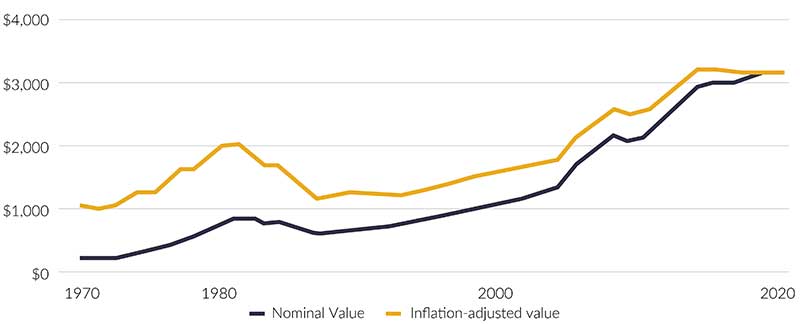
INCREASING FARMLAND VALUES
U.S. farmland’s real value has tripled since 1970.

Source: U.S. Departmen of Agriculture, Ecominc Research Service | Note: Inflation-adjusted data is in 2020 dollars Excludes Alaska and Hawaii
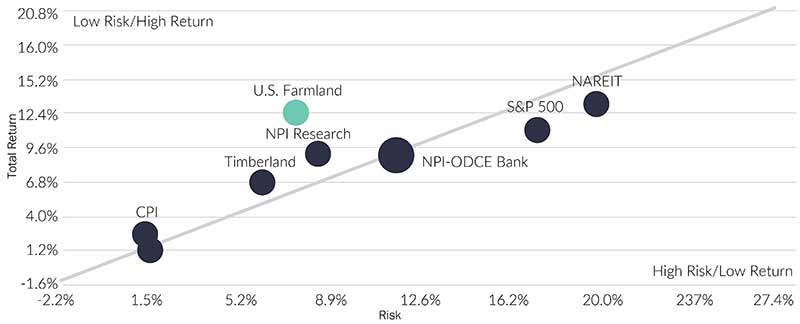
LOW MARKET CORRELATION
With its low correlation to other asset classes, farmland may help to diversify an investor’s portfolio.5
HISTORICALLY STRONG RISK-ADJUSTED RETURNS
U.S. farmland has traditionally offered consistent returns and low volatility compared to other asset classes.6

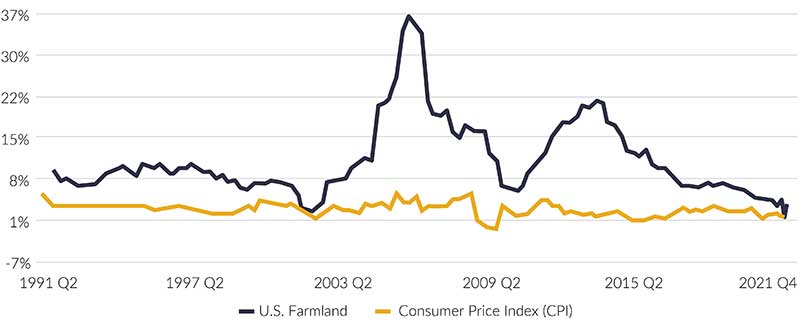
POTENTIAL INFLATION HEDGE
U.S. farmland has generally outpaced inflation across market cycles.6

5.TIAA-CREF Center for Farmland Research, Standard & Poor’s, Federal Reserve, MSCI, Commodity Research Bureau, Consumer Price Index. 1970-2019. Past performance is no guarantee of future results. Potential for profit as well as loss exists. It is not possible to invest in an index. Performance for indices does not reflect investment fees or transaction costs. | 6 NCREIF as of February 28, 2022. These indices are used in comparison to the NCREIF Farmland Index in order to illustrate the differences in historical total returns generated by U.S. Farmland and other major asset classes. The prices of securities represented by these indices may change in response to factors including: the historical and prospective earnings of the issuer, the value of its assets, general economic conditions, interest rates and investor perceptions. All indices are unmanaged and do not include the impact of fees and expenses. Comparisons shown are for illustrative purposes only and do not represent specific investments or the performance of the fund. The returns presented are not indicative of returns to be attained. Diversification does not guarantee against the risk of loss. Past performance does not guarantee future results. The indices presented represent investments that have material differences from an investment in a U.S. Farmland product, including those related to investment objectives, risks, fees and expenses, liquidity and tax treatment.

